 SuperTrail Indicator for TradingView
Hello there, The SuperTrail is a modern percentage based Trailing Stop Loss indicator that can be used on any time frame (down to 1 second candles) across stocks, ETFs, commodities, forex, cryptocurrencies and other investment types. It requires TradingView to work and its goal is to assist you in identifying on a per stock basis bullish and bearish trends to help you stay in your trades longer and most importantly notify you or allow you to set exits for when the trend changes to help you protect your .
The SuperTrail in Action
SuperTrail Advantages
The SuperTrail is a modern, cloud-based indicator built on TradingView to help traders stay in strong trends longer and exit when conditions change. It is simple, visual, and effective for all experience levels.
- Modern indicator created by me in 2020
- Works on all devices using a web browser through TradingView
- Supports any time frame, from monthly charts to one-second candles
- Compatible with stocks, crypto, forex, indices, bonds, and commodities
- Best suited for trending markets, but still useful in ranging or falling markets
- Helps you stay in trades longer to maximise profit and exit when the trend shifts
- Provides a trailing stop loss value to enter into your brokerage platform
- Stop loss adjusts automatically as price moves up, and stays fixed when price falls
- Tailored per instrument, not a single value applied to all
- Identifies average trading range (ATR), entry and exit zones, and target areas when no clear support or resistance is visible
- Helps compare volatility between different instruments
- Fully customisable based on your personal risk preference
- Delivers real-time alerts to your screen, email, mobile, SMS, or webhook
- Supports wick-based logic to avoid premature stop-outs caused by market spikes
- Useful for both fundamental and technical traders

Some ways that I and others use it include:
- It can help you better identify an individual stock's "natural movement" over a period of time allowing you to better time your entries and exits
- It is designed to try and tell you when something unusual is happening to the stock. It is no longer moving in its normal range so a reversal is possibly about to occur - up or down
- It keeps you in the trade longer through wider market volatility. Some stocks will stay in an uptrend for months or years with 100%+ type gains
- The closer the price is to the SuperTrail line and heading back up away from it, in theory the better value the stock is as it is closer to the bottom of its range
- You can use it to identify values from which you can set manual or trailing stop losses in your trading system and thus help you better manage your risk
- I use it a lot on global markets where I am asleep while they are open and where I don't follow or have any insights into the wider market movements. I just want to know if the stock breaks trend I will auto exit because I have stops in place
- Some people hold dozens or even hundreds of stocks in their portfolio. Without some kind of automated risk management, it is simply too complex to keep across the movement of all their stocks. An automated trail set to each stock's specific movements helps to better manage this risk
- You can use it to go long (buy) or short (sell) or both. I remember reading a quote that said only going long (buying) and not being able to short (make money when a stock is falling) is like playing tennis with only a forehand and no backhand
SuperTrail Example Strategy
How you trade should always be up to you. Your money, your risk, your decision. The image below is just one suggestion. You should always come up with your own plan that makes sense to you.

For entries, I typically will not buy a stock if its RSI is below 40 or above 60. If a stock does not meet those levels I would prefer to wait. I also want to see an RSI that is heading upwards.
For exits, the 5% to 6% initial stop in the image above is the maximum I want to risk losing if the trade goes the wrong way. Sometimes a stock can gap down after hours on bad news and sell for a much lower price than your stop, but these are infrequent and it is better to get out than be wiped out. You might also get stopped out and see the stock rise the next day. That is fine. Just buy back in again when you get an alert.
At times the SuperTrail will show that the right stop level is higher than your risk appetite, for example 25% to 30% for some volatile stocks. You can choose to skip that stock or set your own maximum stop loss, for example 15%, even if the indicator suggests more. In my experience, and based on back testing from others, 15% is often a good balance for most stocks. On some stocks where the trail is less than 10% I will add a percent or two to give the stock more room to move.
If you find different ways to use it successfully and develop your own strategy, do let me know :)
Example of a Pattern I Like
This is the kind of pattern I like where the stock has been going up nice and steadily, then had a pull back, and seems to be recovering again and going up. I like that the SuperTrail has resignaled a buy and is further supported by volume seems okay and the RSI is also moving up showing momentum is there. There is a chance it might retrace and come back down, but all I am trying to do is get the odds on my side and hope it continues up. My 6% stop will protect me though if it goes the wrong way and get me out of the trade.

How I Find Trending Stocks
I built a site to help with exactly that: HigherHighs.com
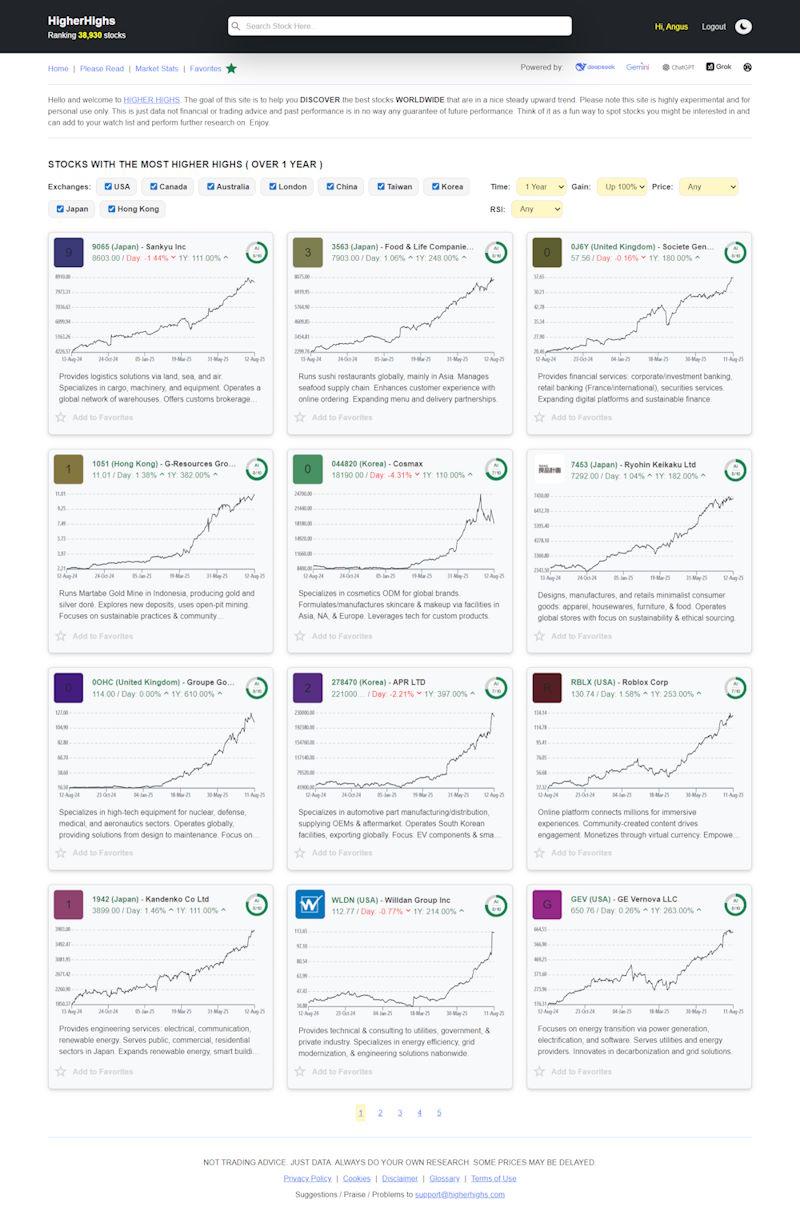
Higher Highs lets you quickly find stocks in clean, steady uptrends across global markets. Pair it with a broker like Interactive Brokers, and you can scan and trade top-performing stocks from just about anywhere. I built it myself and I’m proud of how useful it is. Definitely worth a look.
Another easy approach is to use the built-in TradingView screener. Add some moving averages to your chart, then filter for strong yearly, monthly, and optionally weekly performance. From there, look for stocks where price and the moving averages are running smoothly in parallel. That slow and steady trend is what you're after.
Once you've got a shortlist, refine it based on your own setup. Personally, I look for stocks with RSI rising and sitting between 40 and 60 that shows momentum without being overbought. I like finding ones that have recently pulled back and are starting to push higher again. Simple strategy, easy to follow, and surprisingly effective. Give it a go and see what you find. The trend really can be your friend :)
Video: The Old Way. Finding Trending Stocks Using Moving Averages
* Click on the little [ ] box on the right of the video to view full screen or click here to watch on YouTube.
Video: The New Way. Finding SuperPerformance Stocks Using The Supertrail
The problem with using Moving Averages is they dont tell you much about the volatility of the stock. The SuperTrail does.
By setting it to a default value like 20% I can quickly skim through a list of stocks and find ones where I can buy and in theory hold them longer term because they are less volatile than other similar stocks in the same market - but still making the same or even better gains. Once I have created a short list of these stocks I can then go through them and choose which ones I want to buy, and what the correct "range" is I want to apply as a stop loss to help protect my profits when the trend changes or eventually ends.
In this video I show you how I can find stocks that have made 100%+ type gains over the last 12 months without too much volatility and might be worth keeping an eye on.
* Click on the little [ ] box on the right of the video to view full screen or click here to watch on YouTube.
More SuperTrail Examples

Video: How I use the SuperTrail
* Click on the little [ ] box on the right of the video to view full screen or click here to watch on YouTube.
Video: How the SuperTrail works over time
* Click on the little [ ] box on the right of the video to view full screen or click here to watch on YouTube.
Video: Day Trading using 5 minute candles and 5% trail on a 1500% stock
* Click on the little [ ] box on the right of the video to view full screen or click here to watch on YouTube.
SuperTrail On Apple

SuperTrail On Tesla

SuperTrail On Kogan.com

SuperTrail On Afterpay

SuperTrail On Euro / US Dollar

SuperTrail On Bitcoin

SuperTrail Across Timeframes
A common question I get is will the SuperTrail work across different time frames, and the answer is yes. The below charts are for the same stock (NIO) and look at how the SuperTrail value can be adjusted tighter and tighter depending on your desired timeframe and still achieve good results.
1 Day Candles. 26% SuperTrail. 1350% Run

1 Hour Candles. 20% SuperTrail. 140% Run

1 Minute Candles. 0.6% SuperTrail. 2% Run

1 Second Candles. 0.15% SuperTrail. ~1% Run

Manual Entry for Very Small Values
For values under 1%, enter them manually, for example 0.01% or 0.05%, by typing them directly into the box. This is often useful when trading on very short time frames, such as one-second or five-second candles, or when working with low-volatility assets like FOREX pairs.
SuperTrail Alerts
When trading, I use alerts a lot. If I find a stock that I like the look of that is in say a downtrend and I want to buy when it starts to turn around, I will set an alert on the SuperTrail to alert me when a buy signal occurs. I typically just use email alerts and popups, but you can see from the image below there are a wide variety.

Trailing Stops and How They Work
A trailing stop is a type of stop order that automatically moves up as the stock price rises, locking in gains while still giving the trade room to breathe. It never moves down, so once the stop adjusts higher, that becomes your new minimum exit point.
Rather than having to guess the correct value, the SuperTrail helps you find a trailing stop level that fits the wiggle of the stock AND your risk tolerance, keeping you in trades longer during normal pullbacks but getting you out when a deeper correction occurs. Profit taking by instututional traders, bad news, shifts in sentiment, or broader market weakness can all trigger these larger unexpected drops.
The key is to set a trail wide enough to avoid being stopped out by normal price swings, yet tight enough to protect profits. Even with a good trailing stop, a sudden gap down can mean an exit below your intended price, but that is still better than holding through a larger loss.

Do Trailing Stops outperform Traditional or No Stops and if so what percentage is best?
The short answer is yes. Personally, I like statistics and numbers. I want evidence as to why one strategy might be better than another. These articles below were part of what inspired me to look for how to best protect my downside, and lock in profits and look for a better solution than what was already available. As to what percentage is best, it is completely up to you. Have a look at the stock and see what you think makes most sense over the period you want to buy and hold the stock. But do have a look at the videos and documents below. They will show you that a 15-20% trailing stop loss might be around the right level for many stocks. I had read these years ago but it wasn't until I built and started using the SuperTrail that I realised how insightful these studies were, and I've read dozens of papers (literally) with similar findings. I just liked these the best and thought they were worth sharing.
Watch: The Science of Stop Losses - One of my favorites, and one of those big aha moments. This video gives you an idea of statistically why wider stop losses can be a good thing.
Read: The truth about Stop Losses that nobody wants to believe - A great document that looks at various studies and compares how no stop loss vs stop losses vs trailing stops all perform and what level stops give the best performance.
Example of How I Set Stops in My Trading System
Different platforms handle stops in different ways. My aim when placing an order is to set an initial stop about 5% to 6% below my buy price, then add a percentage trailing stop once the price has risen enough. This gives the stock room to move while limiting loss to around 6% if the trade goes against me. If your broker only supports basic stops, move the stop up manually as the price advances.
I use Interactive Brokers on their app, which is a two step process. First I set a stop 6% below my buy price. The next day, or when I have time, I replace it with a stop that keeps the same stop value and adds a trailing percentage. In the example shown I used a 12% trail. As price rises, the trail lifts the stop price automatically. Gap downs can still exit below the intended level, but risk is contained.
The app does not allow a trailing stop at the same time as the buy order, so I switch it after the fill. Use a percentage trail rather than a fixed value, except for micro or penny stocks where a fixed value may work better. Set time in force so the stop remains active until triggered.
Quick step by step
- Place the buy order.
- Set an initial stop about 6% or so below the target buy price or an obvious area of support where the stock might have dipped to recently before heading back up. Use good till canceled or your preferred persistent option.
- After the fill, remove the initial stop when convenient.
- Create a new stop with the same stop value and add a trailing percentage, for example 12%. Ensure the trail type is percentage.
- Confirm the stop price moves up as the stock rises.
- If your broker does not support trails, move the stop up manually as price advances.

Requirements
The SuperTrail Indicator is designed for TradingView and works on free accounts, but I recommend at least the Pro plan at $14.95 USD per month. TradingView often offers up to 50% off annual plans during Black Friday and Cyber Monday, making it a good time to upgrade. The cost is tax deductible and worthwhile if you are trading with real money.
The Pro plan removes ads and allows access to real-time data packs. These are optional for long-term or swing trading since SuperTrail relies on price action over time, and a 15–20 minute delay will not impact results. Your broker still executes trades using live data.
If you trade short-term or intraday, live data is recommended. Paid plans also provide more alerts and extra features. For most traders, the base Pro plan is sufficient. Live data pricing is listed at the bottom of TradingView’s pricing page under “Available markets.”
Sounds Good? What's It Cost?
The SuperTrail cost me a little bit to have developed so I am asking a one-off payment of $50. Any improvements / upgrades are of course free.
If you'd like to try it then you can use the link below to send payment. After that, message me on TradingView so I can manually add you to the script. Setup is quick and easy and I'm happy to help if you need it. If it’s not for you, I’ll refund you within 24 hours.
Setup Instructions
Once I have confirmed on TradingView that you are added, you can visit the scripts page and click "Add to Favorites." Then open any chart and add the indicator from your favorites list. If you see a "Not Authorized" message, just refresh the page. It will activate once you've been added nd of course let me know if you have any issues or questions.
Hope you like it,
Angus